A while back, I posted an article about a Pseudorandom Number Generator (PRNG) for Direct Sequence Spread Spectrum (DSS) experiments. PRNGs are the key element in many cryptographic applications and they also play a major role in DSSS.
To generate a pseudorandom binary sequence (PRBS), I am using a linear feedback shift register (LFSR). A LFSR is a shift register of which the input bit is a linear function of its previous state. Usually two or more bits of the overall shift register value are exclusive-OR-ed and fed back into the shift register. The bit positions that affect the next state are called the taps.
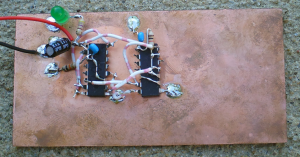
The next picture shows a simple 7 stage PRNG which I am using for the following experiments. A 7-stage shift register can produce a code with a maximal length of 27-1 = 127 code bits. The output sequence almost equals the statistical expectation for a truly random sequence. The numbers have a nearly perfect bell-shaped Gaussian distribution. However, LFSR is deterministic. If any given status of the shift register is known, the next state can be predicted.
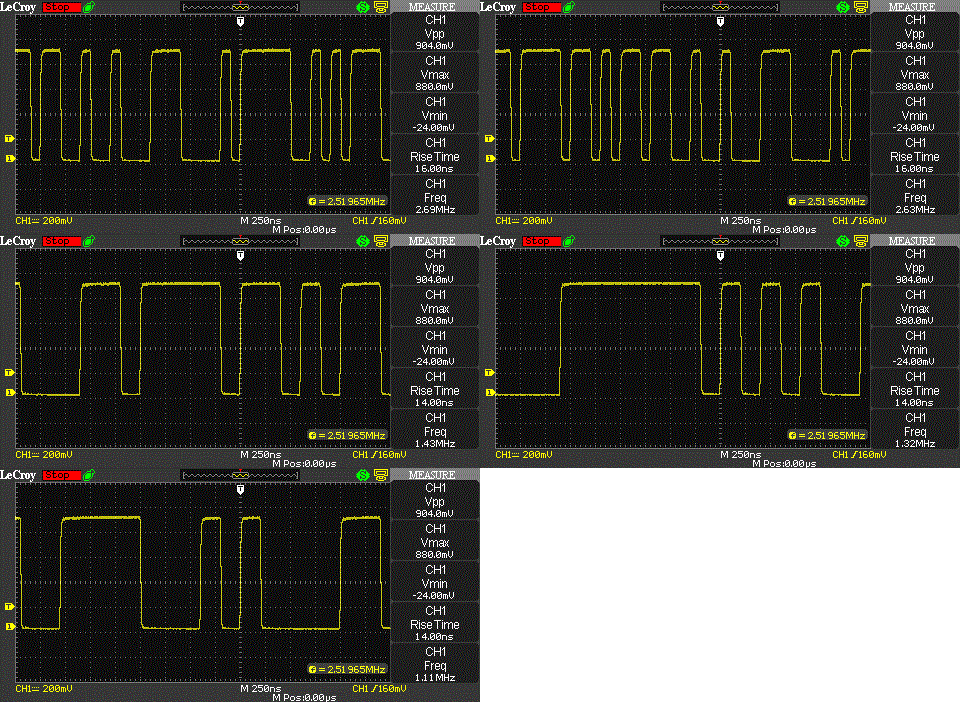
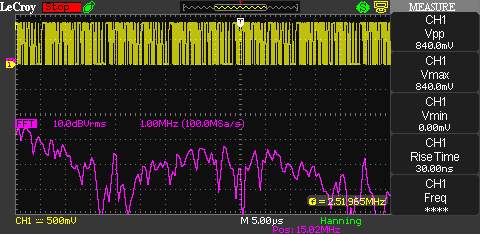
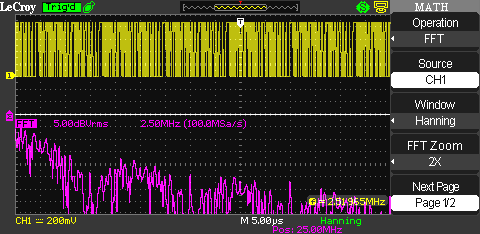
Here is an example output of the PRNG made up out of 5 individual screenshots:
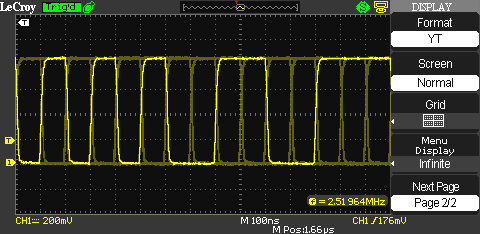
We wouldn’t expect the output frequency to be larger than the clock rate at any point. To confirm this, I am using an eye diagram with infinite persistence. And sure enough, the smallest period length occurring in the output signal is 100 ns (≙ 10 MHz).
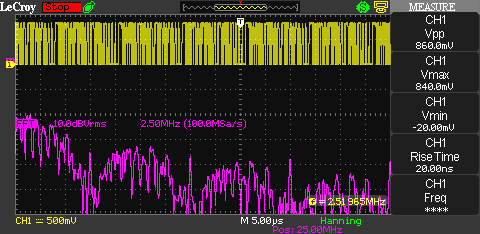
From 0 – 10 MHz, we can see half of a bell curve with its peak at 0 MHz. And as expected, due to the rich content of harmonics of the rectangular signal, we can clearly see a bell shape ranging from 10 to 20 MHz with a peak at 15 MHz. There is another bell shape ranging from 20 to 30 MHz with a peak at 25 MHz.
Zooming in on the 20 to 30 MHz range shows that the distribution looks pretty close to what we expect.
The next picture shows the bell shapes pretty clearly. It also shows how the bell shapes to the right decrease in amplitude as the harmonics are weakening.
To get an idea what an actual DSSS signal looks like, we are going mix a PRBS with a constant carrier. Normally, some transmit data would be XORed with the PRBS before transmission. But for the sake of this experiment, we don’t need any data other than the code sequence (PRBS) itself.
Just like in a real DSSS application, we are going to use an XOR gate as mixer. Essentially, this results in the carrier being modulated with the code sequence (PRBS) using Binary Phase-Shift Keying (BPSK). This is because the XOR will invert (= 180 degree phase shift) the phase relation of the carrier if the modulation input is ‘high’ (logical 1).
So how does the BPSK modulated look like in the frequency domain? There are only a few pictures of DSSS signals available on the web and in literature. Additionally, the quality of those pictures isn’t very good. Let’s ask the WaveAce 1002 scope for help again.
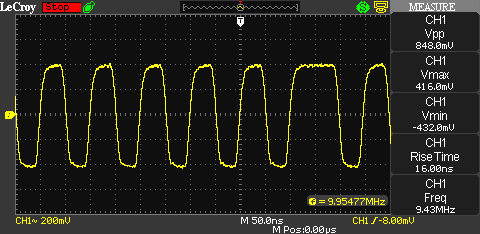
But before we jump into the frequency domain, let’s look at the BPSK signal in the time domain.
For comparison, here is a picture of the unmodulated 10 MHz carrier in the time domain. Other than the 10 MHz carrier, there’s only noise visible.
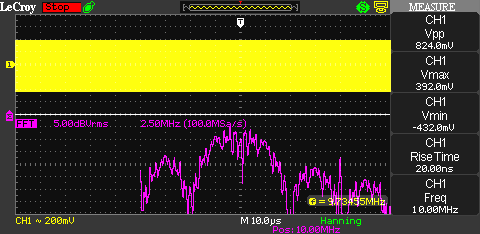
Next, I am going to modulate the carrier with the pseudo random binary sequence. The clock rate of the PRNG is 5 MHz. What do we expect to see? First, we can assume the bandwidth to be 10 MHz. This is because the bandwidth of a BPSK signal is equal to two times the (max.) data rate [1].
Second, the shape can be determined from a theoretical standpoint as well. The XOR mixer adds and subtracts the modulation signal to / from the carrier. Since we know how the output spectrum of the PRNG looks, the shape can be assumed as well. From the addition, we expect to see half of a bell shape starting at 10 MHz and flooring at 15 MHz. Some bell shaped 5 MHz humps should appear directly after that. The subtraction will yield the exact same result, except mirrored around the X-axis starting from the 10 MHz carrier. That would be half of a bell shape starting from 5 MHz and peaking at 10 MHz. Side lobes will appear left from the 5 MHz point with a bandwidth of 5 MHz each. Since negative frequencies don’t exist, there is actually just room for one side lobe in this scenario.
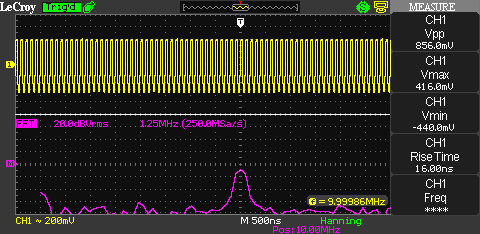
Too much theory? I agree, here’s a pretty picture of the 10 MHz carrier modulated with the code stream clocked at 5 MHz.
And we see exactly what we’d expect. Awesome! In case the theoretical description of the signal was a bit to difficult to follow, try it again with the picture as help. A picture makes so many complex issues much clearer. That’s why pictures are so much more effective than text and an oscilloscope is such a powerful tool.
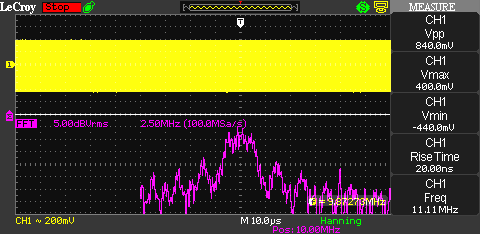
Next up is a picture of the 10 MHz carrier modulated with the code stream clocked at 2.5 MHz. Since the clock rate is half as much in the previous pictures, we’d consequently expect the lobes to be half as wide. The main lobe should have a width of 5 MHz and the side-lobes should be 2.5 MHz wide.
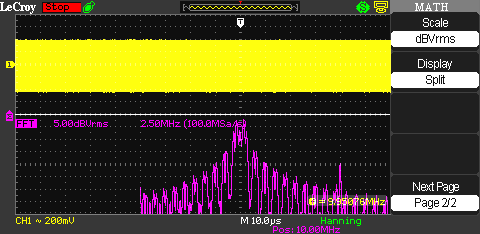
The last picture shows the 10 MHz carrier modulated with the code stream clocked at 1 MHz. The main lobe should have a width of 2 MHz and the side lobes should be 1 MHz wide.
It seems that also this time reality fits the theory. Or the other way around? Ah well, they fit!
In a practical application, the bandwidth of the transmitted signal would of course have to be limited for spectrum efficiency. Interestingly, not all of the main lobe is needed to reliably transport data. To be precise, the overall bandwidth of the transmitted signal can be cut down to be equal to the maximum data rate. This is called the Nyquist bandwidth.
In the case of the 5 Mbps PRBS stream, we could cut the main lobe off to be only 5 MHz wide. This is being done with a raised-cosine filter in a real world application. This is not only true for direct sequence spread spectrum applications but for all digital phase shift keying modes such as BPSK, QPSK, and 8PSK.
I wrote this article for two reasons. The first one being the obvious reason, to show some properties of a DSSS signal. The second reason is that I wanted to show what a powerful tool an oscilloscope is. The LeCroy WaveAce is a entry-level sub $1000 scope [2], yet it mastered the complex tasks in this article with flying colors.
One thing you might have noticed is that I am using an extremely large time base when displaying a FFT of the signal. You can’t tell any signal properties (except amplitude) of the signal in the time domain anymore. All that’s left is a yellow brick. This is intentional. Most scopes logically only perform the FFT on the samples displayed. Since the frequency components of the DSSS signal change rapidly, we need the maximum amount of samples possible. Care needs to be taken to not overdo it, though, else the scope will display an incorrect lower frequency. This effect is called aliasing and occurs in all sampling systems [3].
Update (11/08/2012): I have received an email asking about what the clearly visible spur at 20 MHz is. If you look at the following picture of the DSSS signal again, you can clearly notice the spike at 20 MHz.
What is it and where does it come from? It is simply the harmonic of the original BPSK modulated 10 MHz signal. Because the BPSK causes a phase shift of ± 180 degrees, the phase shift on the second harmonic would be ± 360 degrees. A phase shift of ± 360 degrees is practically equal to no phase change at all. That means the harmonic completely free of any phase modulation whatsoever. This effect is used in a squaring loop to recover the carrier. The received signal is being multiplied with itself (=squared) to generate a signal with twice the frequency of the original carrier but with the phase modulation removed. If the signal is then divided by two, the generated signal is phase-coherent with the original carrier and can be used to recover the data.
Links and Sources:
[1] BPSK, QPSK, 8PSK and QAM Calculator, BalticLab: http://baltic-lab.com
[2] Teledyne LeCroy WaveAce 1002 Review, BalticLab: http://baltic-lab.com
[3] Aliasing, Wikipedia: http://en.wikipedia.org/
Westerhold, S. (2012), "Closer look at a Direct Sequence Spread Spectrum Signal". Baltic Lab High Frequency Projects Blog. ISSN (Online): 2751-8140., https://baltic-lab.com/2012/10/closer-look-at-a-direct-sequence-spread-spectrum-signal/, (accessed: January 25, 2026).
- Conducted Emissions on the Bench: Implementing the CISPR 25 Voltage Method - December 15, 2025
- WebP-Images without Plugin - January 14, 2025
- Firewall Rules with (dynamic) DNS Hostname - January 14, 2025


DSSS / BPSK Clock Recovery with Abracon ABFT
[…] Closer look at a Direct Sequence Spread Spectrum Signal […]
Revue de Presse - 26 Novembre 2012 |
[…] vous la modulation DSSS? Direct Sequence Spread Spectrum… C’est la modulation du wifi. Elle consiste à ne pas envoyer les bits du message un […]