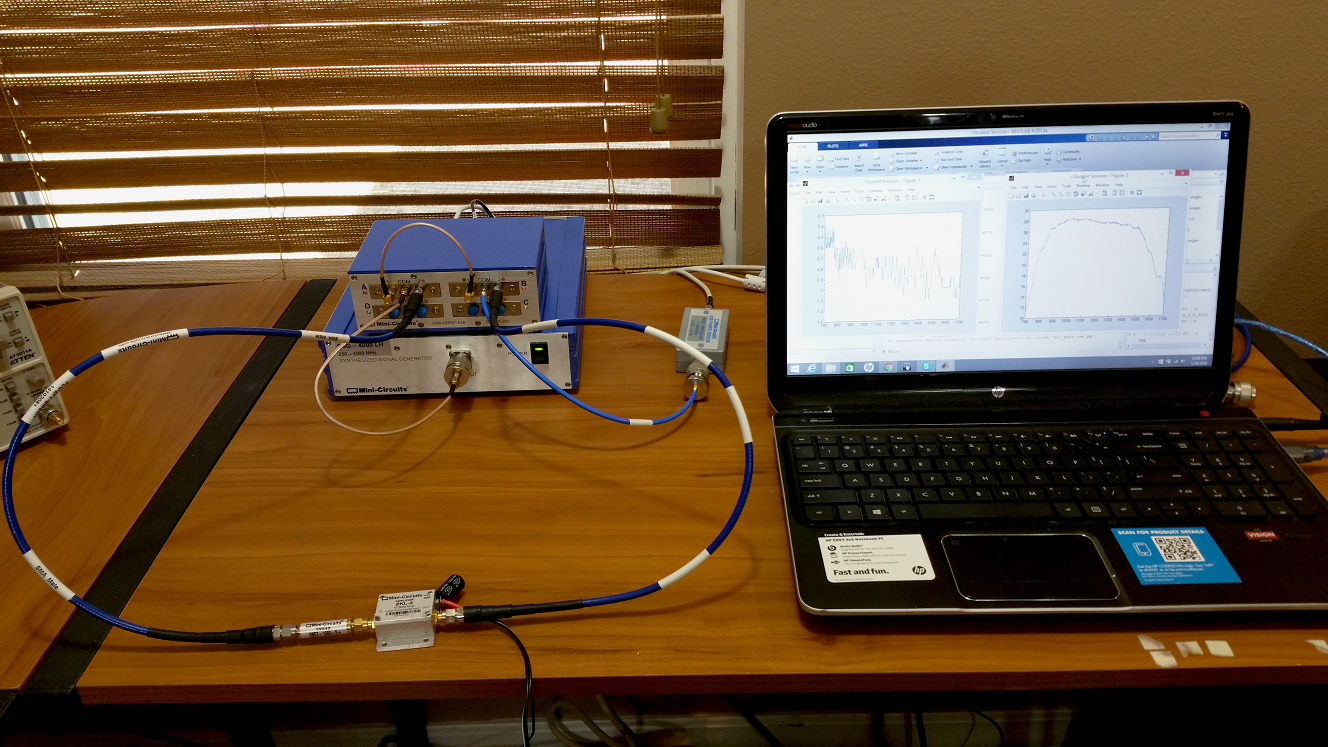
For a long time now I had a bunch of Mini Circuits portable test equipment bits and pieces sitting around. S signal generator, a switch matrix and power sensors. These devices aren’t made for manual operation as they feature no direct way of manipulating the instrument’s state without software. They’re made for automation. And as such i thought an automation example would be in order. Like in the last article, we’re going to have a look at a practical example again. So here are the parameters:
For my passive secondary surveillance receiver at 1090 MHz I am using a Mini Circuits VBFZ-1065 filter [1] and a ZKL-2 amplifier [2]. The filter’s datasheet lists a passband of 980 – 1150 MHz and a 20 dB bandwidth of 630 – 1800 MHz. But let’s see if we can verify the data using an automated test setup.
Measuring the forward gain is quite simple. Simply apply a signal of known amplitude and known frequency to the device under test, measure the output power and compare. Let’s say we apply a 1090 MHz signal with an amplitude of -30 dBm to an amplifier and measure 0 dBm out, we know the forward gain at this exact frequency is 30 dB. So a minimalistic automated setup could consist of just the signal generator as source and the power meter as sink. But we want more than that. Clearly both the generator and the power sensor have certain nonlinearities when it comes to sourcing and measuring a specific amplitude accurately. But these nonlinearities are deterministic and close to constant. Therefore, we can measure the nonlinearities and apply correction factors to our final measurement.
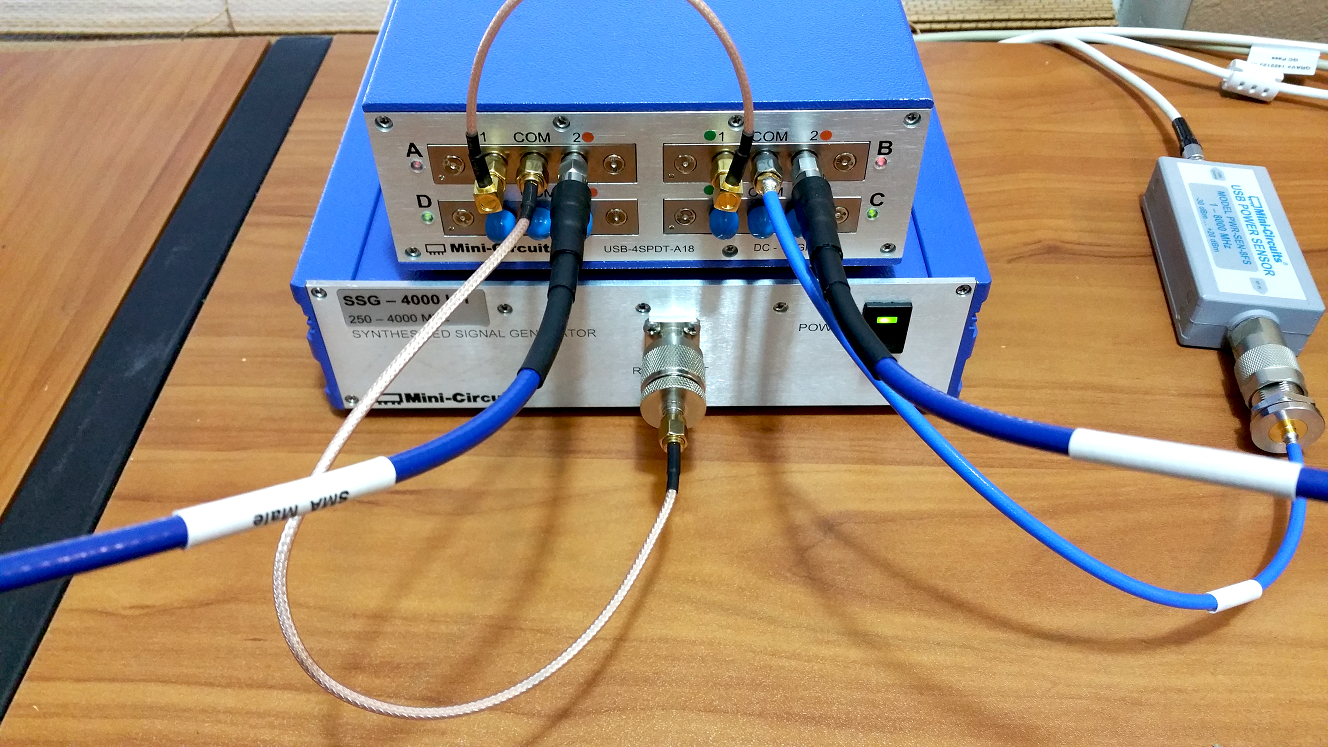
To facilitate this calibration mode, I included the switch matrix. The matrix can switch the source and power sensor directly into each other via a straight through cable jumper or it can switch both to the device under test ports. The following closeup may help understand what I am talking about:
All we need now is MATLAB code. The code’s job in plain english is as follows: Switch the matrix to straight through connection, sweep the system, normalize to intended power level, store normalized values as calibration factors, display cal factors, switch to device under test, sweep system, normalize to calibration values, display sweep results relative to desired output power.
Now in MATLAB speak:
% Connect to PWR Sensor

pm1 = NET.addAssembly('C:\Users\Sebastian\Desktop\MC\mcl_pm64.dll')

obja=mcl_pm64.usb_pm

obja.Open_AnySensor
% Connect to Switch
switch1 = NET.addAssembly('C:\Users\Sebastian\Desktop\MC\mcl_RF_Switch_Controller64.dll')
objc = mcl_RF_Switch_Controller64.USB_RF_SwitchBox
objc.Connect
% Connect to Sig Gen
gen1 = NET.addAssembly('C:\Users\Sebastian\Desktop\MC\mcl_gen64.dll')
objb = mcl_gen64.usb_gen
objb.Connect
% Switch to Cal Bridge
% 0 = Straight Through, 3 = Through DUT
% objc.Set_SwitchesPort(0)
%% Sweep System
% Drive Level in dBm
Power = -30
% Start Frequency in MHz
Fstart = 700
%Step Size in MHz
StepSize = 2.5
%Step Count
Steps = 400
%% Acquire Calibration Values
% Switch to Through Connection
objc.Set_SwitchesPort(0)
% Enable RF
objb.SetPowerON
% Sweep
for C = 1:Steps
% Calculate Frequency
F = Fstart + (StepSize*(C-1));
% Set Frequency and Power
objb.SetFreqAndPower(F,Power,0)
% Allow some settling time
pause(0.25);
% Read Power
PWR=obja.ReadPower
PWR=round(10*PWR)/10
% Write result into Array
A(:,C) = PWR
end
objb.SetPowerOFF
% Normalize
for Count=1:length(A)
A(:,Count)=A(:,Count)-Power;
end
CalValues = A
power = A
% Make Frequency Scale
freq = linspace(Fstart,F,length(A))
% Plot
figure;
plot(freq,power)
%% Acquire Real Values
% Switch to Through Connection
objc.Set_SwitchesPort(3)
% Enable RF
objb.SetPowerON
% Sweep
for C = 1:Steps
% Calculate Frequency
F = Fstart + (StepSize*(C-1));
% Set Frequency and Power
objb.SetFreqAndPower(F,Power,0)
% Allow some settling time
pause(0.25);
% Read Power
PWR=obja.ReadPower
PWR=round(10*PWR)/10
% Write result into Array
Real(:,C) = PWR
end
objb.SetPowerOFF
% Normalize
for Count=1:length(Real)
Real(:,Count)=Real(:,Count)-CalValues(:,Count)-Power;
end
power = Real
% Make Frequency Scale
freq = linspace(Fstart,F,length(Real))
% Plot
figure(2);
plot(freq,power)
%% END
% Disconenct all Devices
obja.Disconnect
objb.Disconnect
objc.Disconnect
You can download the MATLAB file here: MC_Forward_Gain.m
The code was assembled using the various programming examples Mini Circuits offers for download on their website [3]. The overall process to interact with this type of portable test gear is to call a Dynamic Link Library (DLL) and call predefined functions from inside the DLL. The DLLs can be downloaded from the previous link location also.
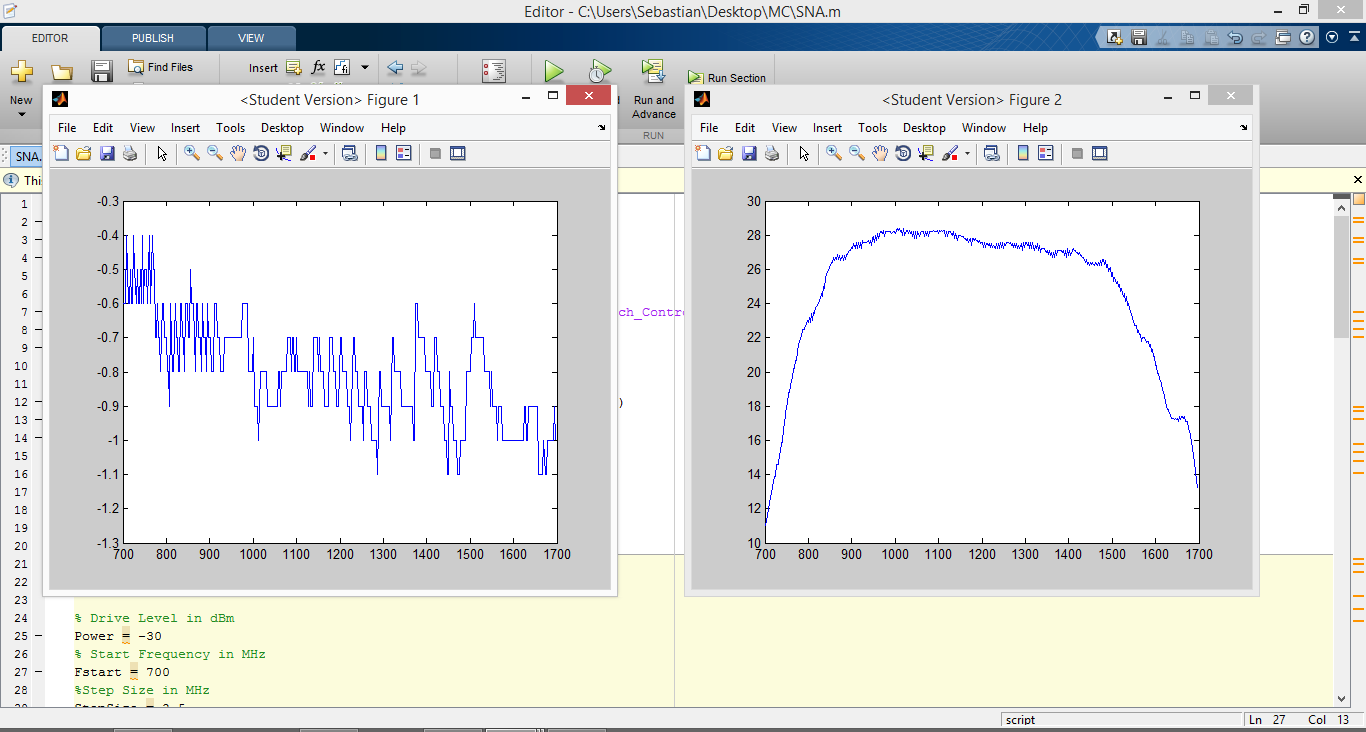
The result for my setup with the VBFZ-1065+ and the ZKL-2 looks something like this:
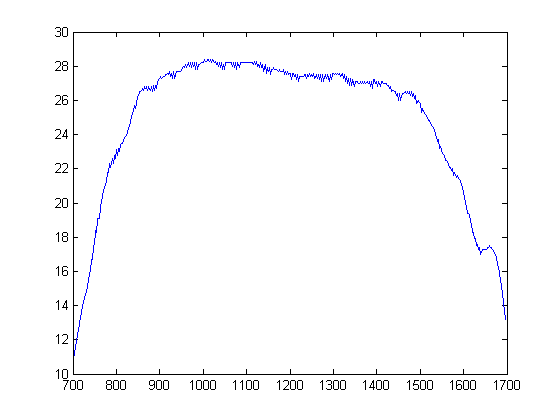
And the forward gain only looks as follows:
Links and Sources:
[1] VBFZ-1065+, Mini Circuits: https://www.minicircuits.com/pdfs/VBFZ-1065+.pdf
[2] ZKL-2, Mini Circuits: http://www.minicircuits.com/pdfs/ZKL-2.pdf
[3] ZKL-2, Mini Circuits: http://www.minicircuits.com/support/software_download.html
Westerhold, S. (2016), "Automated Forward Gain Measurement". Baltic Lab High Frequency Projects Blog. ISSN (Online): 2751-8140., https://baltic-lab.com/2016/01/automated-forward-gain-measurement/, (accessed: February 11, 2026).
- Conducted Emissions on the Bench: Implementing the CISPR 25 Voltage Method - December 15, 2025
- WebP-Images without Plugin - January 14, 2025
- Firewall Rules with (dynamic) DNS Hostname - January 14, 2025


