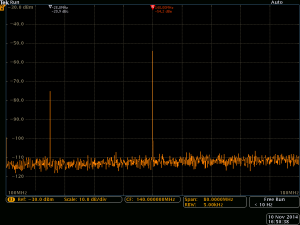
With a 100 MHz, 0 dBm signal applied to the spectrum analyzers input and the SignalVu-PC settings set to 100 MHz center frequency, 40 MHz span, the signal at the ADC input looked like this:
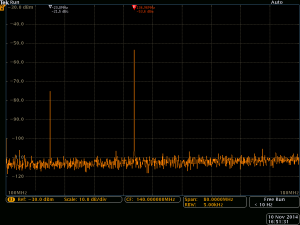
So indeed, 140 MHz is our strongest peak. 20 dBc lower is a 28 MHz peak. Before taking the picture I of course tried a large span to make sure that there aren’t any relevant signals at a lower frequency. So the next test uses a 105 MHz signal still at 0 dBm.
So indeed, it seems that the LTC2261-14 samples the 140 MHz IF directly. How you ask? The answer is undersampling. The ADC is actually sampling at 112 Msamples/s. As a result, it sees an alias of the 140 MHz signal at 28 MHz. That’s all the magic happening here.
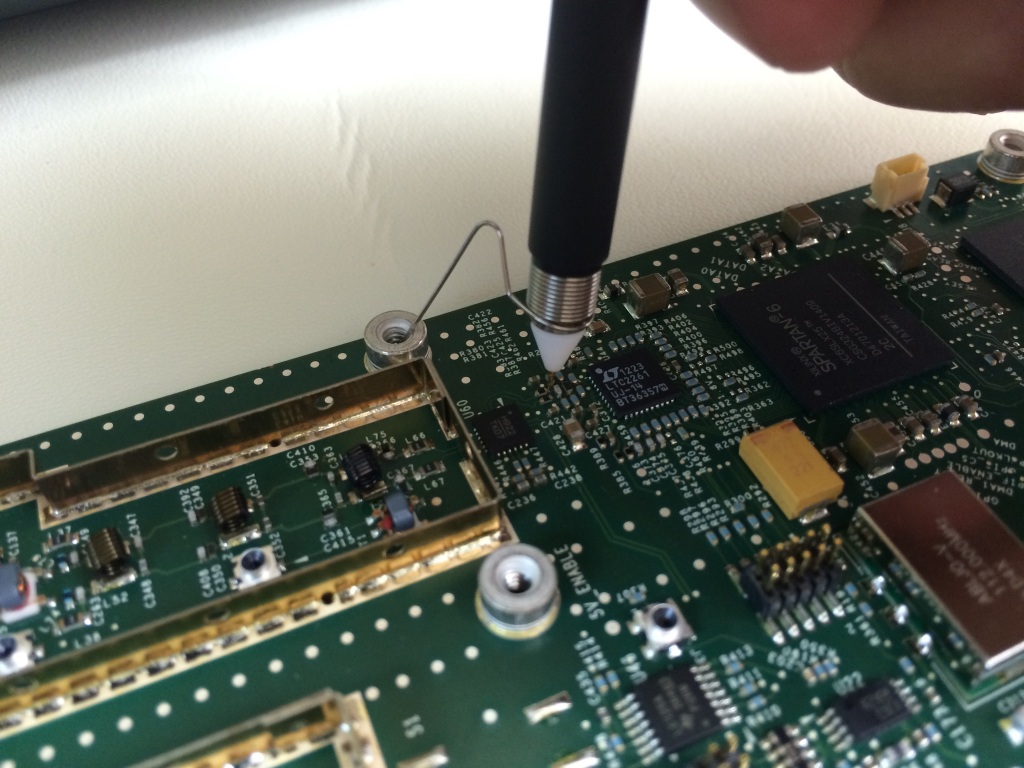
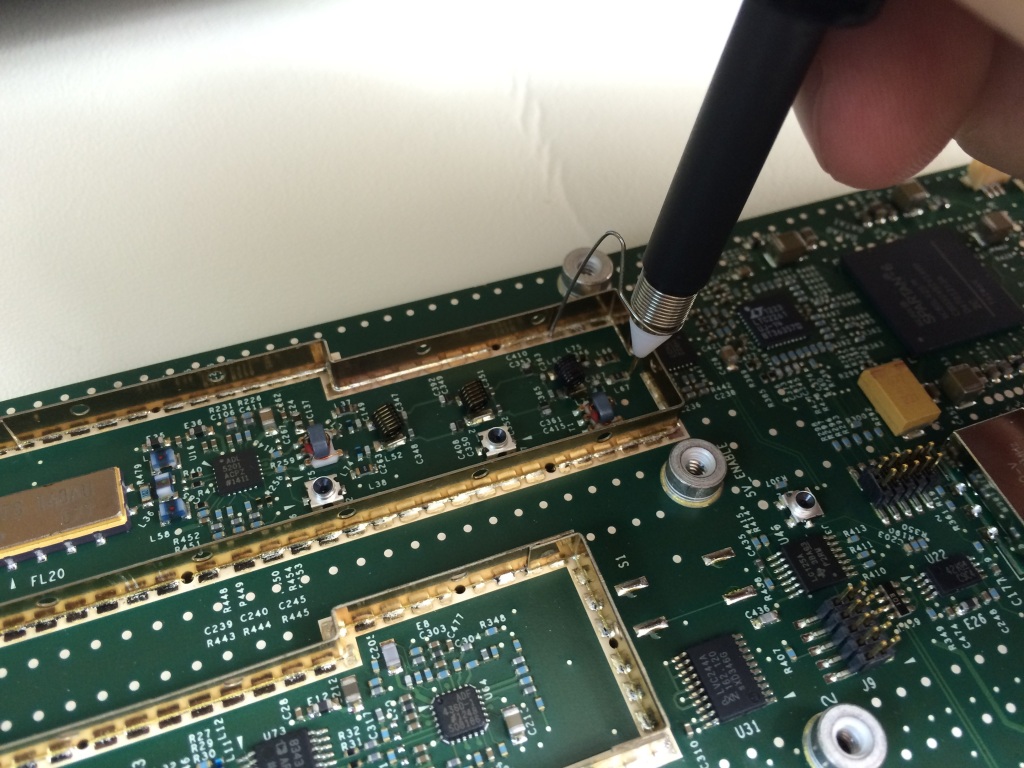
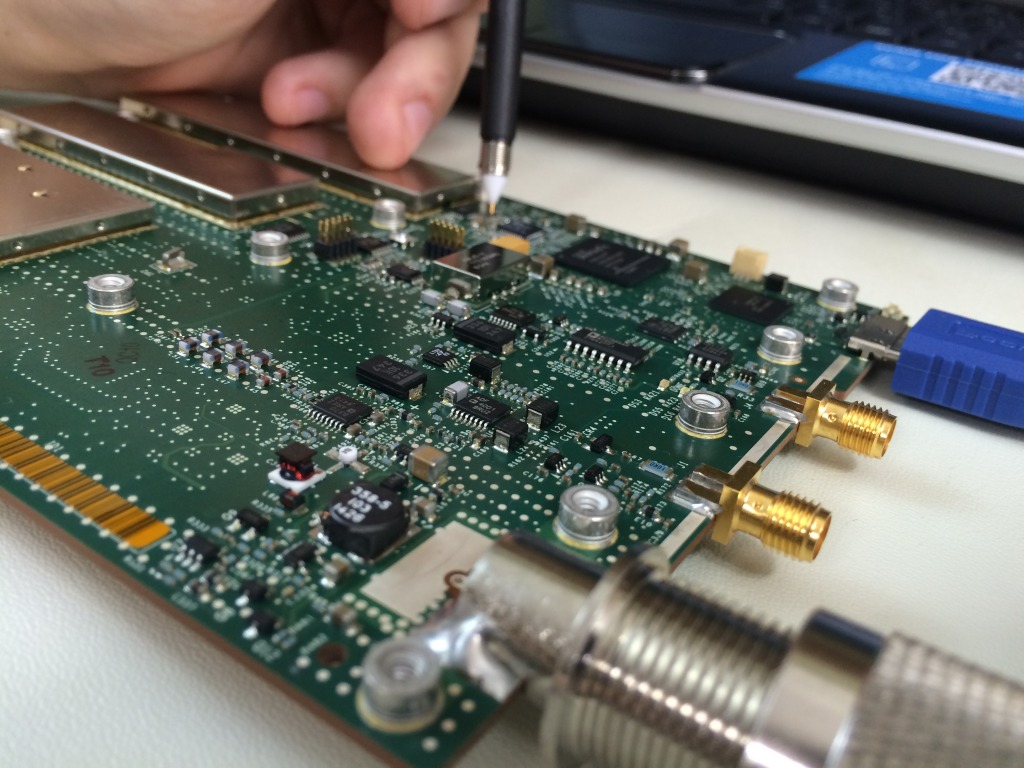
This probing expedition also yielded some pretty pictures that I would like to share. Enjoy!
Westerhold, S. (2014), "Tektronix RSA306 IF Frequency Verification". Baltic Lab High Frequency Projects Blog. ISSN (Online): 2751-8140., https://baltic-lab.com/2014/11/tektronix-rsa306-if-frequency-verification/, (accessed: December 13, 2025).
- WebP-Images without Plugin - January 14, 2025
- Firewall Rules with (dynamic) DNS Hostname - January 14, 2025
- Restoring proxied visitor IPs from Cloudflare - December 26, 2024
Gavin
Could you post a high resolution picture of the backside of the board. You video did not show circuits leading into the 1st mixer’s (LTC5510) RF and IF paths.
KF5OBS
Snap! Already put it back together and the amounts of super glue I had to use make another teardown impractical. I have a whole fault full of pictures of the board on my phone though. Not certain if they show the desired areas but if you eMail me ([email protected]), I’ll package the images up for you and eMail / Dropbox them to you.
Shantel
Very well written! Keep up the fabulous work! 🙂
John
This could be useful for me. Thank you very much for sharing.